Beacon Villages

Belstone - South Tawton - South Zeal - Sticklepath
Under Cosdon Beacon Dartmoor Devon UK
Under Cosdon Beacon Dartmoor Devon UK
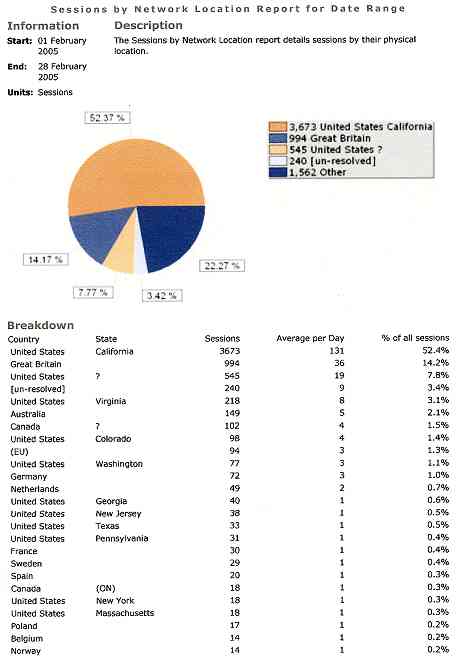
Site Statistics
The number of visits is down but there were 3 less days in February so the number of visits per day is slightly up. Also, as the duration per visit is also slightly higher, the total number of hours visited in the month is higher. Possibly the bubble will burst soon, as the new monthly content does not hold one's attention as does going through all the other pages for the first time. However, the attention is nice and I would like to thank all the visitors to the site. |
|||||||||||||||||||||||||||||||||||||||||||||||||||||||||||||||||||||||||||||||||||||||||||||||||||||||||||||||||||||||||||||||||||||||||||||||||||||||||||||||||||||||
|
|||||||||||||||||||||||||||||||||||||||||||||||||||||||||||||||||||||||||||||||||||||||||||||||||||||||||||||||||||||||||||||||||||||||||||||||||||||||||||||||||||||||
New York viewing has now tripled to 0.03%! Wow!! |
|||||||||||||||||||||||||||||||||||||||||||||||||||||||||||||||||||||||||||||||||||||||||||||||||||||||||||||||||||||||||||||||||||||||||||||||||||||||||||||||||||||||
 |
|||||||||||||||||||||||||||||||||||||||||||||||||||||||||||||||||||||||||||||||||||||||||||||||||||||||||||||||||||||||||||||||||||||||||||||||||||||||||||||||||||||||