Beacon Villages

Under Cosdon Beacon Dartmoor Devon UK
The trend in visits is still up but the duration of visits is falling. Whilst it is gratifying that more and more people are visiting the site, the shorter duration of visit might indicate that a lot got here by accident and went away again just as fast. Of course, it could always mean that the front page is not friendly or inviting enough to make them want to look further. I would genuinely welcome criticisms and suggestions for improvements to either navigation or content to make this site a better experience. The e-mail link is just above! |
|||||||||||||||||||||||||||||||||||||||||||||||||||||||||||||||||||||||||||||||||||||||||||||||||||||||||||||||||||||||||||||||||||||||||||||||||||||||||||||||||||||||
|
|||||||||||||||||||||||||||||||||||||||||||||||||||||||||||||||||||||||||||||||||||||||||||||||||||||||||||||||||||||||||||||||||||||||||||||||||||||||||||||||||||||||
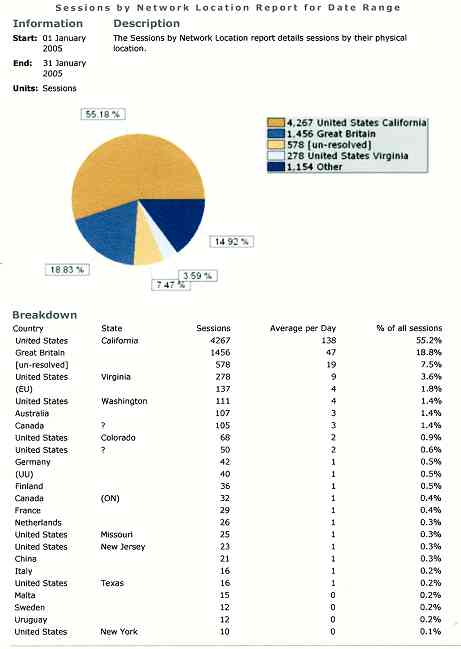
I am still wondering what it is that appeals to Californians (55.2%) as opposed to New Yorkers (0.1%)? |
|||||||||||||||||||||||||||||||||||||||||||||||||||||||||||||||||||||||||||||||||||||||||||||||||||||||||||||||||||||||||||||||||||||||||||||||||||||||||||||||||||||||
 |
|||||||||||||||||||||||||||||||||||||||||||||||||||||||||||||||||||||||||||||||||||||||||||||||||||||||||||||||||||||||||||||||||||||||||||||||||||||||||||||||||||||||